News Center
-
Home > News Center > Company News
Source: Energy Research Club WeChat Official Account Authors: Zheng Xuguang, Wang Xuechen, Zhao Juntao
In 2019, China’s economy maintained overall stability and steady progress. The Statistical Communiqué on National Economic and Social Development in 2019 released by the National Bureau of Statistics in late February showed that the gross domestic product (GDP) reached 99.0865 trillion yuan, an annual increase of 6.1%. Converted at the annual average exchange rate, China’s GDP totaled $14.4 trillion, ranking second in the world, with per capita GDP exceeding $10,000. Both the total GDP and per capita level reached new historical milestones.
In 2019, China’s total social electricity consumption grew steadily, with continuous optimization of the consumption structure. A 4.5% growth in power consumption supported a 6.1% growth in the national economy. The total energy consumption for the year was 4.86 billion tons of standard coal, an increase of 3.3% over the previous year, with the growth rate remaining unchanged from the previous year. The growth rate of power consumption fell by 4 percentage points compared to the previous year. The power installed capacity exceeded 2 billion kilowatts, the power production and supply capacity continued to increase, the power source structure was further optimized, and the power supply service quality steadily improved, but the growth rate of power installed capacity and grid scale slowed down. The power supply and demand situation continued to be generally balanced.
In 2019, energy conservation and emission reduction in the power industry were further advanced. The national average power supply coal consumption, line loss rate, and pollutant emission levels all steadily declined, and the proportion of ultra-low emission retrofits for coal-fired power units was further increased. With the deepening of the domestic carbon market construction, the pressure on carbon management in the thermal power industry increased.
In 2019, new progress was made in the reform of the power system. The second round of cost supervision and review for transmission and distribution pricing was launched, the proportion of market transaction electricity increased further, the scope of the power auxiliary service market was expanded, and the system peak regulation potential of approximately 65 million kilowatts was tapped. All pilot projects for the construction of power spot markets entered settlement trial operations, the pilot projects for the reform of incremental power distribution business were expanded, and the fifth batch of pilot project applications was launched. The power business environment was continuously optimized, and social electricity costs were reduced by nearly 100 billion yuan.
Looking ahead to 2020, China will comprehensively build a moderately prosperous society in all respects and achieve the first centenary goal. At present, the pressure of economic downturn, coupled with the impact of the COVID-19 pandemic, has led to downward adjustments in economic growth expectations at home and abroad, which will undoubtedly further reduce electricity consumption growth expectations, making the internal and external environments for power development more complex. However, on the whole, the long-term positive fundamentals of China’s economy have not changed, and the momentum of high-quality development in the power industry will continue.
1.Steady Growth in Total Social Electricity Consumption and Continuous Optimization of Power Consumption Structure
I.
Total social electricity consumption increased by 4.5% year-on-year, exceeding 7 trillion kWh for the first time
In 2019, China’s total social electricity consumption grew steadily. According to data from the China Electricity Council (CEC), the national total social electricity consumption in 2019 was 7.23 trillion kWh, a year-on-year increase of 4.5%, with the growth rate decreasing by approximately 4 percentage points compared to the previous year, the lowest growth rate since 2015. Factors such as the slowdown in demand growth for electricity consumption in the three industries and urban and rural residential areas, and the high base in 2018, jointly led to the slowdown in the growth rate of total social electricity consumption. According to the National Bureau of Statistics, the preliminary accounting showed that the total energy consumption in 2019 was 4.86 billion tons of standard coal, an increase of 3.3% over the previous year. Coal consumption increased by 1.0%, crude oil consumption increased by 6.8%, and natural gas consumption increased by 8.6%. The consumption of clean energy such as natural gas, hydropower, nuclear power, and wind power accounted for 23.4% of the total energy consumption, an increase of 1.3 percentage points.

Express Data for 2019, other data from CEC annual power industry statistics; growth rates are calculated values, same below unless specified otherwise
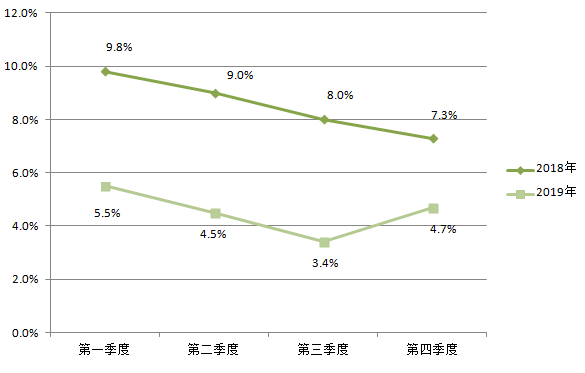
Image2 Quarterly Growth Rates of National Total Social Electricity Consumption in 2018 and 2019
In 2019, the growth rates of total social electricity consumption in each quarter were 5.5%, 4.5%, 3.4%, and 4.7%, respectively. By comparison, the growth rate in each quarter of 2019 was lower than the same period in 2018.
(II.)
Tertiary Industry and Residential Electricity Consumption, Continuous Optimization of Power Consumption Structure
In 2019, electricity consumption in various industries grew steadily. By industry, electricity consumption in primary industry was 78 billion kWh, a year-on-year increase of 4.5%; electricity consumption in secondary industry was 4,936.2 billion kWh, a year-on-year increase of 3.1%, of which industrial electricity consumption was 4,847.3 billion kWh, a year-on-year increase of 2.9%; electricity consumption in tertiary industry was 1,186.3 billion kWh, a year-on-year increase of 9.5%; and urban and rural residential electricity consumption was 1,025 billion kWh, a year-on-year increase of 5.7%.
Table1 Electricity Consumption by Industry, 2010–2019 (Unit: 100 million kWh)
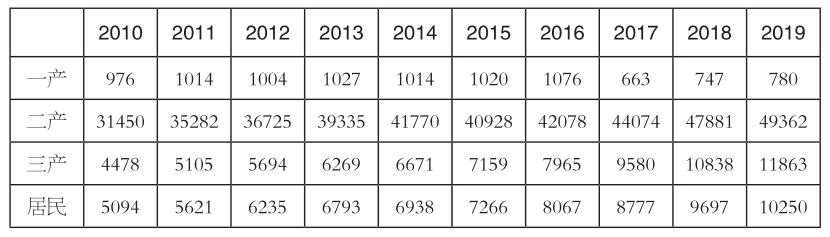
In 2019, the growth rates of electricity consumption in the three industries and urban and rural residential areas decreased by 5.3, 4.1, 3.2, and 4.7 percentage points, respectively. In the secondary industry, electricity consumption in the four high-energy-consuming industries increased by 2.0% over the previous year, of which electricity consumption in the building materials industry grew by 5.3%, that in the ferrous metals industry by 4.5%, that in the chemical industry remained flat, and that in the nonferrous metals industry decreased by 0.5%. Electricity consumption in high-tech and equipment manufacturing, consumer goods manufacturing, and other manufacturing industries grew relatively steadily, increasing by 4.2%, 2.2%, and 6.3% respectively over the previous year. In the tertiary industry, electricity consumption in information transmission/software and information technology services, leasing and business services, real estate, wholesale and retail, and transportation/warehousing and postal services grew rapidly, with growth rates all above 10%.
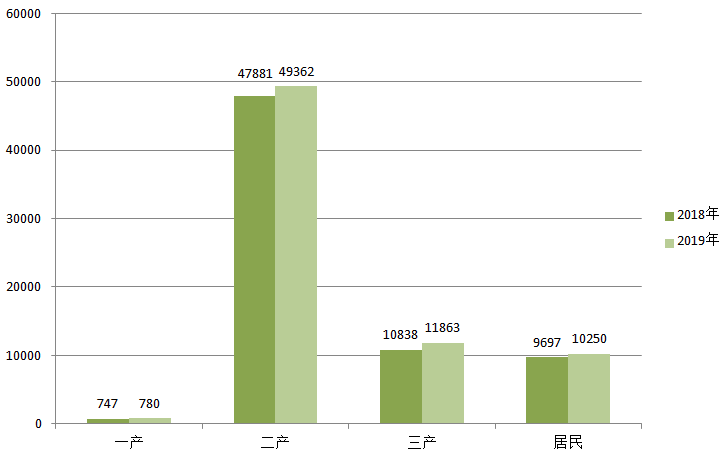
In recent years, the proportion of secondary industry in total social electricity consumption has continued to decline, while the proportion of tertiary industry and urban and rural residential electricity consumption has continued to increase. Since 2009, the growth rate of electricity consumption in the tertiary industry has continued to be higher than that in residential electricity consumption. It is worth mentioning that in 2019, electricity consumption in the tertiary industry and urban and rural residential areas drove the growth of total social electricity consumption by 1.5 and 0.8 percentage points respectively, with their contributions to the growth of total social electricity consumption being 33.1% and 17.9% respectively, totaling 51.0%, of which the contribution rate of the tertiary industry increased by 10.1 percentage points compared to the previous year.

II. Slowdown in Growth Rate of National Power Installed Capacity and Power Generation, Further Increase in Proportion of Clean Energy Installed Capacity
(1)
Slowdown in Growth Rate of National Power Installed Capacity, Installed Capacity Exceeding 2 Billion Kilowatts